 Cloud Native Maps
An open source JavaScript SDK for visualizing unlimited geo-spatial data using only your web browser.
Cloud Native Maps
An open source JavaScript SDK for visualizing unlimited geo-spatial data using only your web browser.
Examples Strategy Documentation Download ChangeLog
Documentation
Required JavaScript Sources
Cloud Native Map Class
Sample Code
JSON Catalog Configuration
Layers
Data Sets
Raster Palettes
Data Creation, COG & FGB
Useful Tips
Required JavaScript Sources
The CloudNativeMap SDK relies heavily on the work of others. Here are the minimum packages to add to your .html <HEAD>. If your javascript lives in a separate file be sure to add that, too, with the 'defer' attribute.
   <link rel="stylesheet" type="text/css" href="https://unpkg.com/leaflet@1.9.4/dist/leaflet.css" crossorigin="">
   <script src="https://unpkg.com/leaflet@1.9.4/dist/leaflet.js" crossorigin=""><script>
   <script src="https://cdn.jsdelivr.net/npm/underscore@stable/underscore-umd-min.js" crossorigin=""><script>
   <script src="https://unpkg.com/flatgeobuf/dist/flatgeobuf-geojson.min.js" crossorigin=""><script>
   <script src="https://cdnjs.cloudflare.com/ajax/libs/proj4js/2.9.2/proj4.min.js" crossorigin=""><script>
   <script src="https://unpkg.com/georaster" crossorigin=""><script>
   <script src="https://unpkg.com/georaster-layer-for-leaflet/dist/georaster-layer-for-leaflet.min.js" crossorigin=""><script>
   <script src="https://www.cloudnativemaps.com/js/cloud-native-map-latest.js" crossorigin="" defer><script>
Cloud Native Map Class
CloudNativeMap(options, geoRasterOptions)
options:
   map           : map object created by Leaflet L.map, required
   url           : required if 'catalog' not specified. Location of JSON configuration file
   catalog       : required if 'url' not specified. Catalog object of previous CloudNativeMap instance, ie, cnm.catalog
   layers        " Required. CSV of layers defined in JSON configuration file to show on map
   enableUpdate  : default 1. All 'layers' are visible upon creating instance as they meet visibility criteria.
   minFetch      : minimum size in bytes of FGB file fetched to add to map, default 2,000.
   updateFileSize: if FGB file size in bytes is less than this, the entire file is uploaded. Otherwise, data loaded as needed, as defined by viewport bounding box. Default 500,000.
geoRasterOptions: // georaster options as defined by georaster-for-leaflet
   resampleMethod: nearest|bilinear. Default is 'nearest'
   resolution    : Default is 256, don't use > 512.

Properties:
   catalog     : JSON object of all layers and datasets definitions.
   activeLayers: CSV of current layers 'lid'. Modified by methods showLayer/hideLayer. Initialized with 'layers' from instance creation.
   layers      : array of objects, with Leaflet layers, created from individual COG/FGB files that meet visibility criteria, key => object. Volatile.

Methods:
   setEnableUpdate([0|1])              : hide or show ALL active layers.
   showLayer("lid")                    : show layer "lid" defined in catalog.json, adds to active layers.
   hideLayer("lid")                    : hide layer "lid" defined in catalog.json, removes from active layers.
   getCatalogDatasetIdxByLid("lid")    : string, get dataset index by catalog layer "lid".
   setPalette("lid", function)         : user defined palette function layer should use to draw raster.
      function(
         values      : array of RGB(A) decimal values
         ,layer      : layer as defined in JSON catalog
         ,noDataValue: no data value
         ,lut        : Look up table, if raster has one, array of RGB(A) decimal values
         ,scaleFn    : scaling function to scale pixel values with
      )
   clipLayer(opts)                     : clip raster layer with provided vector polygon
      opts = {
         maskLayer: f.maskLayer  // 'lid' of 'layers' raster defined in JSON catalog.
         ,mask: f.geometry       // Leaflet GeoJSON object vector polygon
      }
      See raster clipping example for full code and usage.
Sample Code
basic.html:
<body onload="init()">
   <div id="map" style="width: 800px; height: 600px; margin: auto;"><div>
<body>
basic.js:
function metersToFeet(v = 0) { return Math.round(v * 3.28084); }

function init() {
   var map = L.map('map', {minZoom: 0, maxZoom: 20}).setView([39, -100], 4);
   var cnm = new CloudNativeMap({
      map: map
      ,url: "https://www.cloudnativemaps.com/examples/basic.json"
      ,layers: "dem,state"
   });
}

function featureTooltip(f = null, l = null) {
   let txt = "";
   for(let key in f.properties) {
     txt += "<strong> + key + ": <strong> + f.properties[key] + "<br>";
   }
   l.bindTooltip(function (layer) { return txt; }, {sticky: true, direction: "top"});
}
basic.json:
{
   "layers": [
      {
         "lid": "dem"
         ,"datasets": "dem30m"
         ,"zIndex": 505
         ,"minPixelValue": -315
         ,"maxPixelValue": 15000
         ,"onEachPixel": "metersToFeet"
         ,"palette": "grayscale"
      }
      ,{
         "lid": "state"
         ,"datasets": "state"
         ,"zIndex": 600
         ,"geoJSONOpts": {
            "style": {
               "color": "#faa500"
               ,"fillColor": "transparent"
               ,"weight": 4
            }
            ,"onEachFeature": "featureTooltip"
         }
      }
   ]
   ,"datasets": [
      {
         "lid": "state"
         ,"type": "FGB"
         ,"baseUrl": "https://www.cloudnativemaps.com/cnm/data/vector/"
         ,"extent": "-124.848537,24.396308,-66.885444,49.384479"
         ,"items": [
            {"item": "states_1.fgb", "minZoom": 1, "maxZoom": 11}
            ,{"item": "states_2.fgb", "minZoom": 12, "maxZoom": 20}
         ]
      }
      ,{
         "lid": "dem30m"
         ,"type": "COG"
         ,"minZoom": 1
         ,"maxZoom": 20
         ,"baseUrl": "https://www.cloudnativemaps.com/cnm/data/raster/"
         ,"extent": "-126.0351562,21.9430214,-65.9177021,50.0641917"
         ,"items": [
            {"item": "conusDem30m_cog.tif"}
         ]
      }
   ]
}
JSON Catalog Configuration
{
   "layers": [
      {}
      ,{}
      ...
   ]
   ,"datasets": [
      {}
      ,{}
      ...
   ]
}
Layers
"layers": [
   {
      "lid": "uniqueId1"
      ,"datasets": "vectorDataSet1,vectorDataSet2,etc"
      ,"zIndex": 610
      ,"geoJSONOpts": {
         "style": {
            "color": "#7777aa"
            ,"fillColor": "transparent"
            ,"weight": 2
         }
         ,"onEachFeature": "userDefinedFunction"
      }
      ,"maskLayer": "uniqueId2"
      ,"filterFunction": "userDefinedFunction"
   }
   ,{
      "lid": "uniqueId2"
      ,"datasets": "rasterDataSet1,rasterDataSet2,etc"
      ,"zIndex": 600
      ,"minPixelValue": -1000
      ,"maxPixelValue": 15000
      ,"onEachPixel": "userDefinedFunction"
      ,"colors": "#805000,#8f5902,#a06b16,#bf8c3b,#dcab5e,#eec989,#f7e4b5,#fdf7d3,#ffffe0,#f5f9df,#dfe9dc,#bfd3d8,#98b8d4,#6c9acb,#4878b2,#3465a4"
      ,"values": "-1000,0,1000,2000,3000,4000,5000,6000,7000,8000,9000,10000,11000,12000,13000,14000,15000"
      ,"onEachPixel": "userDefinedFunction"
      ,"palette": "gradient|grayscale|LUT|RGB|step"
   }
]
Layer Attributes
lid          : "string"
   Required, a unique user defined id
datasets     : "CSV string"
   Required, data set(s) to include in layer
zIndex       : integer
   Vector layers are always on top of raster layers. zIndex orders stacking in each group
style        : function () | {}
   Vector only. User function returning CSS object or CSS object. CSS attributes are JavaScript syntax.
maskLayer    : "string"
   Vector only. Raster layer lid of raster to clip.
geoJSONOpts  : Leaflet GeoJSON object
   Vector only. Options passed directly to Leaflet's GeoJSON object.
filterFeature: function (Object feature)
   Vector only. User function to filter based on attribute in feature.properties. Should always return boolean.
onEachPixel: function (Number pixelValue)
   Raster only. User function to scale pixel value, such as conveting meters to feet or normalizing, etc.
minPixelValue: Number
   Raster only. Minimum pixel value to display, uses scaled pixel value
maxPixelValue: Number
   Raster only. Maximum pixel value to display, uses scaled pixel value
values       : "CSV numbers"
   Raster only. Scaled values to use for palette functions. Value/color mapping. CSV number
colors       : "CSV hex color values"
   Raster only. Colors to use for palette functions. Value/color mapping. CSV of RGB(A) hex colors
palette      : "string"
   Raster only. Palette to use for drawing raster, driven by colors/values. Palette 'RGB' works with 3-band or 4-band alpha.
georasterOpts: georaster-for-leaflet JSON object
   Raster only. Georaster options passed directly to georaster-for-leaflet, JSON object
Data Sets
"datasets": [
   {
      "lid": "uniqueId"
      ,"type": "[FGB|COG]"
      ,"baseUrl": "http[s]://path/to/data/"
      ,"extent": "xmin,ymin,xmax,ymax"
      ,"zIndex": integer
      ,"minZoom": [1-20]
      ,"maxZoom": [1-20]
      ,"items": [
         {"item": "file1.fgb", "minZoom": 1, "maxZoom": 5, "extent": "xmin,ymin,xmax,ymax" }
         ...
      ]
   }
   ,{}
]
Data Set Attributes
lid    : Required. A unique user defined id, string
type   : Required. Supported cloud native spatial data type, FGB|COG, string
baseUrl: Required. The base url of files, https[s]://, string
items  : Required. Individual files that make up data set, all located under 'baseUrl'
extent : Required here or for each 'item'. The bounding box of all items, in SRS of file(s), CSV string
zIndex : Optional, FGB only. Setting the layer zIndex in 'datasets' takes precedence over zIndex in 'layers'.
minZoom: minimum zoom level to show data set, takes precedence over 'layer' minZoom, integer
maxZoom: maximum zoom level to show data set, takes precedence over 'layer' maxZoom, integer
   item   : filename, string
   minZoom: minimum zoom level to show file, takes precedence over above minZoom, integer
   maxZoom: maximum zoom level to show file, takes precedence over above maxZoom, integer
   extent : Required here or above. Extent of this file only, in SRS of file. Takes precedence over above extent, CSV string
Raster Palettes
Within your layers you can choose from a number of different palettes to draw your COG's. You may have single band or multi-band rasters. There are options for each and the ability to create your own palette function.
palette: grayscale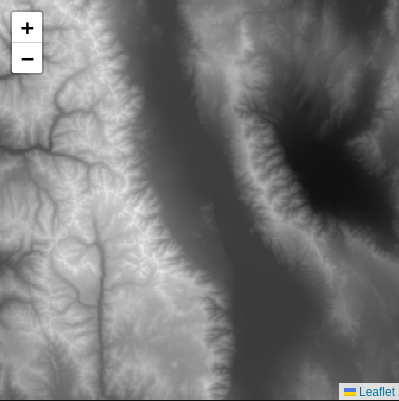 |
Example layer:
{
   "lid": "dem"
   ,"datasets": "dem30m"
   ,"zIndex": 505
   ,"minPixelValue": -315
   ,"maxPixelValue": 15000
   ,"onEachPixel": "metersToFeet"
   ,"palette": "grayscale"
}
Used for a single band COG. The datasets in your layer may consist of more than one COG. Using a min/max pixel value ensures that all rasters have a uniform gradient. Without it, it uses the min/max found in each COG, the result is probably not what you want.
|
palette: LUT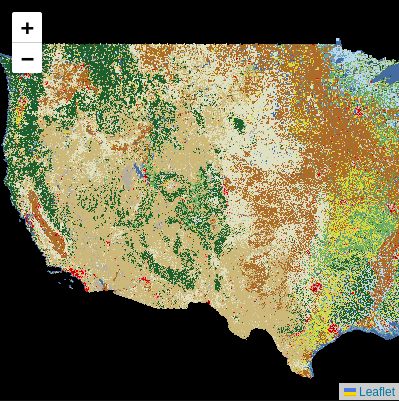 |
Example layer:
{
   "lid": "nlcd"
   ,"datasets": "nlcd"
   ,"zIndex": 500
   ,"palette": "LUT"
}
Uses the COG's internal pixel value/color lookup table.
|
palette: RGB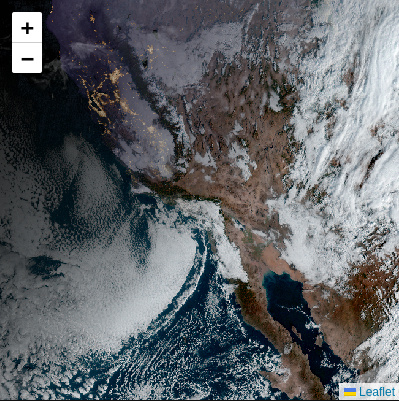 |
Example layer:
{
   "lid": "goes"
   ,"datasets": "goes"
   ,"zIndex": 505
   ,"palette": "RGB"
}
Draws a 3 or 4 band RGB(A) COG raster. Assumes the 4th band, if it exists, is alpha (transparency).
|
palette: gradient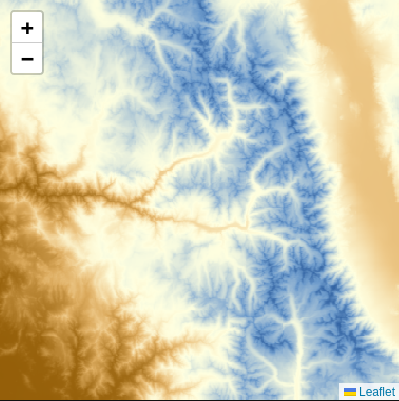 |
Example layer:
{
   "lid": "elevStep"
   ,"datasets": "dem30m"
   ,"zIndex": 500
   ,"minPixelValue": -1000
   ,"maxPixelValue": 15000
   ,"onEachPixel": "metersToFeet"
   ,"colors": "#805000,#8f5902,#a06b16,#bf8c3b,#dcab5e,#eec989,#f7e4b5,#fdf7d3,#ffffe0,#f5f9df,#dfe9dc,#bfd3d8,#98b8d4,#6c9acb,#4878b2,#3465a4"
   ,"values": "-1000,0,1000,2000,3000,4000,5000,6000,7000,8000,9000,10000,11000,12000,13000,14000,15000"
   ,"palette": "gradient"
}
Used for a single band COG. Maps pixel value range to a color. Gets the percentage of that range and interpolates between colors, resulting in a smooth gradient using user defined colors and values.
|
palette: step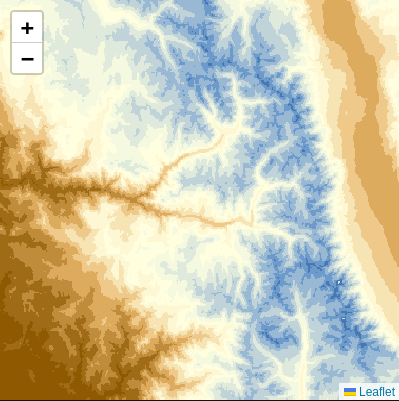 |
Example layer:
{
   "lid": "elevStep"
   ,"datasets": "dem30m"
   ,"zIndex": 500
   ,"minPixelValue": -1000
   ,"maxPixelValue": 15000
   ,"onEachPixel": "metersToFeet"
   ,"colors": "#805000,#8f5902,#a06b16,#bf8c3b,#dcab5e,#eec989,#f7e4b5,#fdf7d3,#ffffe0,#f5f9df,#dfe9dc,#bfd3d8,#98b8d4,#6c9acb,#4878b2,#3465a4"
   ,"values": "-1000,0,1000,2000,3000,4000,5000,6000,7000,8000,9000,10000,11000,12000,13000,14000,15000"
   ,"palette": "step"
}
Used for a single band COG. This is similar to gradient, except no color interpolation happens between values. It's a single solid color.
|
customPalette: esaPalette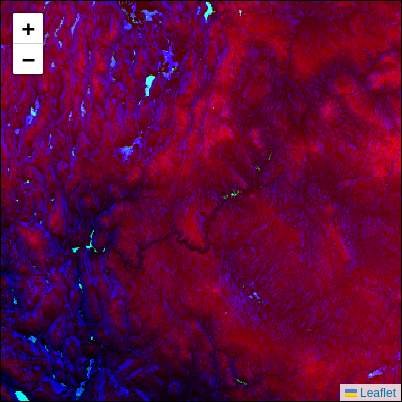 |
Example layer:
{
   "lid": "esa"
   ,"datasets": "esa"
   ,"zIndex": 500
   ,"minPixelValue": -113
   ,"maxPixelValue": 4409
   ,"customPalette": "esaPalette"
}
A user defined function called 'esaPalette' is used to draw this 3 band COG. Bands are elevation, slope and aspect. That function is:
function esaPalette(values = null, entry = {}, noDataValue = null, p = null, scaleFn = null) {
   if(!values.length) return null
   let p1 = (values[0] > entry.maxPixelValue ? entry.maxPixelValue : values[0]) / entry.maxPixelValue;
   let p2 = (60 - (values[1] > 60 ? 60 : values[1])) / 60;
   let p3 = (values[2] > 179 ? values[2] - 180 : 180 - values[2]) / 180;
   return 'rgb(' + parseInt(255 * p1) + ',' + parseInt(255 * p2) + ',' + parseInt(255 * p3) + ')';
}
|
Data Creation, COG & FGB
Your data files must be in the correct geospatial format. Raster is Cloud Optimized GeoTiff (COG) and vector is FlatGeobuf (FGB). Here are 2 basic GDAL commands for creating each.
Let's create a COG. Assume your source raster is plain GeoTiff, it could be any raster format. If your source is anywhere near 2GB, use the BIGTIFF switch. For COMPRESS use DEFLATE or LZW for best compatability:
gdalwarp -f COG -co BIGTIFF=YES -co COMPRESS=DEFLATE -t_srs EPSG:4326 source.tif target_cog.tif
Now let's create an FGB file. Let's assume your source vector data file is a shapefile, .shp. Using the -simplify switch we can dramatically reduce the file size and number of vertices in our geometries, while preserving topology. This is great for creating small vector files at low, say 1-10, zoom levels. With FGB always use the -nlt switch so your layer type is a multi-geometry. The -makevalid switch will correct any dubious geometries where it can. All geometries are expected to be the same, no mixed geometries, all linestring or all polygon or all point.
ogr2ogr -t_srs EPSG:4326 -nlt PROMOTE_TO_MULTI -makevalid -nln layerName -simplify .001 lowResolution.fgb source.shp
That's it! The gdalwarp/gdal_translate and ogr2ogr commands have many options. These utilities will come in very handy no matter what GIS field you're in.
Useful Tips
If your data sets contain many files, it can be tedious to manually create numerous 'item' array values. Here's a quick script to create the 'items' array for raster data in your data sets JSON, given the 'baseUrl' directory. On Linux, gdalinfo and jq required:
#!/bin/bash

src="/path/to/data/dem10m/cog"
echo "$src"
tpl=',{"item": "%s", "extent": "%f,%f,%f,%f"}'

for fil in $(ls $src | grep "\.tif" | sort |tr -d "\r" |tr "\n" " ") ; do
   printf -v dem '%s/%s' $src $fil
   json=$(gdalinfo -json $dem | jq .cornerCoordinates)
   printf "         $tpl\n" \
      $fil \
      $(echo $json | jq .lowerLeft[0]) \
      $(echo $json | jq .lowerLeft[1]) \
      $(echo $json | jq .upperRight[0]) \
      $(echo $json | jq .upperRight[1])
done
# end script
The results should look something like this:
         ,{"item": "n26w081.tif", "extent": "-81.001667,24.998333,-79.998333,26.001667"}
         ,{"item": "n26w082.tif", "extent": "-82.001667,24.998333,-80.998333,26.001667"}
         ,{"item": "n27w081.tif", "extent": "-81.000556,25.999444,-79.999444,27.000556"}
         ...
CloudNativeMaps.com © 2024 :: Contact :: Portfolio :: X/Twitter